
 If you missed the first part of this series, where you can read about what is a shellcode and how it works, you can find it here: Part I. In this part, I will cover required information in order to be able to properly write a shellcode for Windows platform: the Process Environment Block, the format of Portable Executable files and a short introduction to x86 Assembly. This article will not cover all the aspects of these concepts, but it should be enough in order to properly understand shellcodes.
Process Environment Block
Within Windows operating system, PEB is a structure available for every process at a fixed address in memory. This structure contains useful information about the process such as: the address where the executable is loaded into memory, the list of modules (DLL), a flag specifying if the process is being debugged and many others.
It is important to understand that the structure is intended to be used by the operating system. It is not consistent across different Windows system versions, so it may change with each new Windows release, but some common information has been kept.
As we discussed in the first article, the DLLs (due to ASLR) will be loaded at different memory addresses so we cannot use fixed memory addresses in our shellcode. But we can use this structure, found at a fixed memory address, in order to find the location of DLLs into memory.
If you are familiar with C/C++, it is pretty easy to understand what information does this structure contains and where. The official Microsoft documentation shows the following fields:

As you can see, some fields called “Reserved” are not described but some other fields are documented.
For those unfamiliar with C/C++, you have to understand this: a BYTE means… a byte, a PVOID is a pointer (a memory address) – so it is 4 bytes on a x86 system (32 bit system) and PPEB_LDR_DATA is a pointer to a custom structure called PEB_LDR_DATA. There are two bytes reserved for the first field (because Reserved1[2] is an array of two BYTEs), the BeingDebugged flag is 1 byte followed by another byte (Reserved2). Reserved3[2] is an array with 2 pointers (so 2 * 4 bytes = 8 bytes) and Ldr is a pointer – 4 bytes.
From this structure, we will use the Ldr pointer, witch we can find at offset 12 (or 0xC) within the structure (2 bytes Reserved1 + 1 byte BeingDebugged + 1 byte Reserved2 + 8 bytes Reserved3).
The PEB_LDR_DATA contains the following information:

We will act as before. We can access the InMemoryOrderModuleList field at offset 20 (0x14 in hex: 8 bytes Reserved1 + 3 * 4 bytes Reserved2). This field will give use information about loaded DLLs.
Here things are a bit more complicated. We can get loaded DLLs information using a structure called LDR_DATA_TABLE_ENTRY. The official Microsoft documentation does not publish the whole structure contents but we can find more information here:
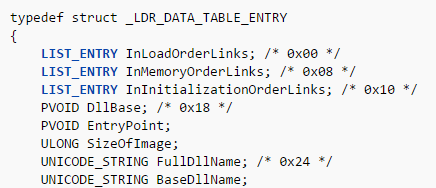
The LIST_ENTRY structure is a simple double linked list, containing a pointer to next element (Flink) and a pointer to previous element (Blink), each one having 4 bytes:
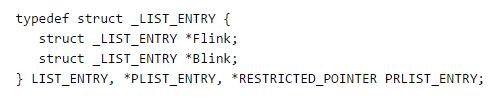
The InMemoryOrderModuleList field is a pointer to a LIST_ENTRY field of a LDR_DATA_TABLE_ENTRY structure. It is NOT a pointer to the beginning of the LDR_DATA_TABLE_ENTRY structure, it is a pointer to the InMemoryOrderLinks field of the structure! As you can see, Flink and Blink are pointers to a LIST_ENTRY structure.
Let’s take it step by step:
- Read the PEB structure
- Go to offset 0xC to Ldr pointer
- Go to offset 0x14 to InMemoryOrderModuleList field
At this moment we are placed on the InMemoryOrderLinks element of the first module loaded into memory. This module is the executable file (for example calc.exe). We want to navigate through all loaded DLLs. InMemoryOrderLinks, being a LIST_ENTRY structure – where first 4 bytes are the Flink pointer and the next 4 bytes are the Blink pointer, allows us to navigate to the second loaded module through the first 4 bytes. We need to do this one more time and we can access information about the third loaded module.
The InMemoryOrderModuleList list offers us a list of all loaded modules in the following order:
- calc.exe (the executable)
- ntdll.dll
- kernel32.dll
As we discussed in the first article, we need access to kernel32.dll in order to access function like GetProcAddress and LoadLibrary that will help us to call any Windows API function.
In order to finish our goal, we have to read the DllBase field (the memory location where the DLL is loaded into memory) from the current LDR_DATA_TABLE_ENTRY structure. The DllBase is stored at offset 0x18 in the structure, but we have to take care that we are already at the offset 0x8 (InMemoryOrderLinks field) so we just jump 0x10 bytes to get the DllBase.
Here is the perspective of all required steps necessary to find kernel32.dll memory address:

My Paint skills are not awesome, but I hope you can figure out how it works. Just remember that navigating through modules is done using the “Flink” pointer representing the first 4 bytes we are placed on.
Do not be scared about this! As you will see, it is possible to do this in only 8 (more or less) lines of Assembly code.
Portable Executable file format
The Portable Executable is a file format used by executables and dynamic libraries (DLLs) on Windows system. The format describes the content of these files: the headers and sections containing all code and data used by PE files.
There is plenty of documentation on the Internet, but here I want to describe you only the necessary information required to write a shellcode: the overview, headers, sections and the export table.
A really short illustration on PE files:

As you can see in this picture, a PE file contains:
- a DOS (old Microsoft operating system) header
- a DOS stub – small program that prints “This program cannot be run in DOS mode”
- PE headers (different useful information)
- a section table (headers for sections)
- sections (code and data sections)
A more detailed look will show us what a PE file opened in a hex editor contains:

The format is pretty complicated, but we just need to know how to parse the PE headers in order to get exported functions.
Let’s start with the DOS header. DOS header is represented as the following structure:

You can find the complete structure and all other required structures within “WinNT.h” header files of C/C++ compilers.
All PE files (EXE or DLL) will start with this structure. So, after we find a module in memory, at that memory address we will find this structure. You can recognize it by its first two bytes: “MZ“, this being the e_magic field representing the “signature” of the DOS header.
The only thing we need to know is the e_lfanew field of the structure. This field is located at offset 0x3C and it shows us the location of the PE header.
The PE header is a structure that contains the following information:
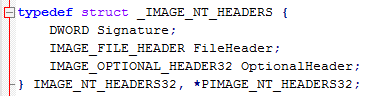
It contains the PE signature (you can see a “PE” string if you open a PE file with an editor), the FileHeader, a structure containing information like the number of sections (code and data), the “machine” type (x86, x64, ARM…) and “characteristics” determining among other information if the file is an executable (.exe) or a dynamic link library (.dll).
The OptionalHeader is a structure containing more useful information for us.
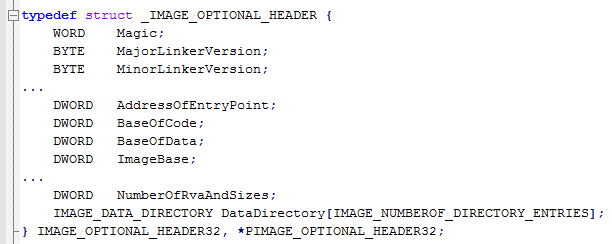
It contains information such as:
- AddressOfEntryPoint – where the exe/dll starts executing code
- ImageBase – where the DLL should be loaded (if possible) into memory
- DataDirectory – information such as imported and exported functions
We are interested only on the last field, DataDirectory, because we need to get the exported functions. This is how a DLL works: it contains different functions and this functions are exported, so other application can just load the DLL into memory, find the exported functions and call them. As an example, “MessageBox” is an exported function from “user32.dll” (actually, there are two versions: ASCII and Unicode).
The DataDirectory field of the structure is an array of IMAGE_DATA_DIRECTORY structures. The IMAGE_DATA_DIRECTORY is the following:
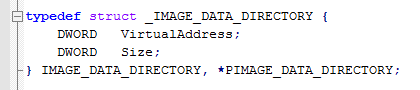
So at the end of the OptionalHeader structure there are IMAGE_DATA_DIRECTORY structures (16 actually). It is important for our scope to understand that the first one is the “export directory” data directory.
In order to go to the export directory, we just need to follow the VirtualAddress field of the structure which point to the start of the export directory. A DWORD represents a type on 4 bytes and a WORD is just 2 bytes. If you will sum all the sizes of the elements until the DataDirectory array, you will notice that there are 120 bytes (0x78) bytes from the beginning of the PE header to the beginning of the DataDirectory array. So at offset 0x78 we will find the virtual address (VirtualAddress field) to the export directory.
The export directory is the following structure:
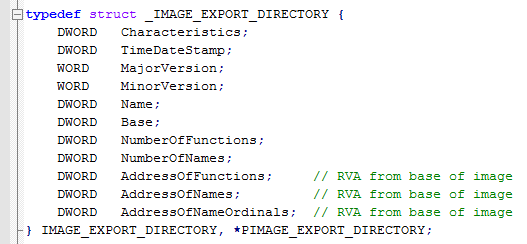
From this structure we will use the following fields:
- AddressOfFunctions – Address of an array of “pointers to functions”
- AddressOfNames – Address of an array of “pointer to function names”
- AddressOfNameOrdinals – Address of an array of ordinals (16 bit integers)
Let’s take as an example a DLL with three functions.
- AddressOfFunctions = 0x11223344 —-> [0x11111111, 0x22222222, 0x33333333] – The 0x11223344 is a pointer to an array containing the addresses of the functions: 0x11111111, 0x22222222 and 0x33333333 are the addresses of the functions.
- AddressOfNames = 0x12345678 —> [0xaaaaaaaa -> “func0”, 0xbbbbbbbb -> “func1”, 0xcccccccc -> “func2”] – The 0x12345678 is a pointer to an array of pointers to function names: 0xaaaaaaaa is a pointer to the “func1” string representing the exported function name and so on.
- AddressOfNameOrdinals = 0xabcdef —> [0x00, 0x01, 0x02] – The 0xabcdef is a pointer to an array of integers (on two bytes) representing the offsets of each function in the AddressOfFunctions array.
In order to get a function address by its name, we check the names by parsing the AddressOfNames array. First function (func0) will have the ordinal 0, second function (func1) will have the ordinal 1 and third function (func2) will have the ordinal 2. So if we are searching for the func2 function, we will access the element 2 (starting from 0) of the AddressOfFunctions array.
Shortly, it is like this: function_address=AddressOfFunctions[ Ordinal(function_name) ].
Don’t be scared about this, as you will see, it is possible to do all this stuff in about 15-20 lines of assembly code.
Assembly language
Even if it is possible to write shellcode in C/C++ as you can see in this article, if you want to properly understand what is does, how it works and how can you modify it, you should be able to understand and write assembly code.
In this section I will provide only a few basics on the assembly language, please do not rely on this section and read a good article such as this one in order to properly understand ASM. The descriptions within this post will not be complete, I just want to cover some common operations in order to be able to write a simple shellcode.
In order to avoid different complications, I will write all the examples below using inline assembler on the Microsoft Visual C++ Express Edition compiler. However, you may find more convenient to use an assembler such as MASM, NASM or YASM.
Let’s start with the “variables”. The processor uses different registers (think about them as variables) in order to store temporary data. They have different purposes, but here we will treat them as “global variables”. For a better description you can read this article.
There are a few general purpose registers: EAX, EBX, ECX, EDX, ESI and EDI. Each of them can store 4 bytes of data. Also, the lowest 2 bytes of them can be referred as AX, BX, CX, DX, SI and DI. The last byte is accessible as: AL, BL, CL, DL. The following picture describes this:

Let’s say the execution of our program starts at address 0x12345678. There is a special register that holds the current address of execution called EIP (Instruction Pointer). After executing an instruction, this register will be automatically changed to the address of the next instruction.
Ok, now that we have “variables”, let’s see what can we do with them. There are multiple instructions we can use in order to do something useful.
Instructions:
- mov destination, source – Will “move” the value from source to destination, will affect the source
- add destination, source – Will add the source to the destination or destination = destination + source
- sub destination, source – Will substract the source from the destination or destination = destination – source
- inc destination – Will increase destination value with 1
- dec destination – Will decrease destination value with 1
A few examples:
[code]
; Comments can be specified by starting with a ;
mov EAX, 5 ; Put value 5 in the EAX
add EAX, 2 ; Add 2 to EAX, EAX will be 7
inc EAX ; EAX will be 8
mov EBX, 2 ; Store value 2 in EBX
sub EAX, EBX ; EAX will be 6
[/code]
You can test this on Visual C++ like in the following picture:

It is possible to place a breakpoint, a point where the Visual C++ debugger will stop, by clicking the left grey line. When you will start the program it will stop at the specified breakpoint. Now, on bottom you will see a “Watch1” window. That is the place where you can add the register names in order too see their values. So add EAX, EBX and so on and watch them.

You can press F11 to execute the instructions one by one and you will see in the watches window, how the value was modified. Oh, or you can just keep the mouse pointer over the register names in order to see their values. Just note that this is very basic, you can use a debugger like Immunity Debugger for an advanced functionality, but to keep it simple you can just use this one.
The control flow of the program will pass through some decision sequences, to compare two values in order to take different actions. First of all, you need to know that you can use labels. As you will see, labels are just “names” for different locations of code. And you can use “jumps” to reach them.
Useful instructions:
- jmp address/label – Will unconditionally jump to a label or memory address
- cmp destination, source – Will compare destination to source by substracting (without affecting the operands) the source from the destination. The “result” will not be saved, just remember that if the source is equal with the destination, a flag, called “Zero Flag” will be set. This flag will be used later by the next conditional jumps
- jz address/label – Will jump to the specified label or address if the “Zero Flag” is set (jz = Jump if Zero), so if we had before a “cmp” instruction where the parameters where equal, the flag was set and the code will jump to the specified address/label. If not, nothing will happen, the execution will go to the next instruction
- jnz address/label – The opposite of jz (jnz = Jump if Not Zero), the code will jump to the specified address if the Zero Flag was not set, so if the cmp instruction operands where different.
There are many other jump instructions available, but this should be enough for the beginning. As an example, you can try the following code:

We can go now to an important part of ASM programming: the stack. The stack is a place in memory where you can store data. Think about it as a memory space where you can put data like you can put plates, one above each other and you can get them only from the top.
There are two useful instructions to work with the stack:
- push value – Will put the value on the stack
- pop register – Will take the value from the top of the stack and it will store it in the specified register
There are two registers that “point to the stack”
- ESP register (Stack Pointer) – points to the top of the stack
- EBP register (Base Pointer) – points to the “base” of the stack. We will not cover this here
A few important things happen when we work with the stack. Let’s say the ESP, the top of the stack, is the value 0x11223344. If we push some data (4 bytes) with the “push 0xaaaaaaaa” instruction, the 0xaaaaaaaa value will be put on the top of the stack and the ESP value will DECREASE with 4 bytes. So we can say that the stack grows to lower addresses. After the push instruction, the ESP will be 0x11223340
If we get data from the stack, everything happens the other way: the data is removed from the stack (actually, it is still there, for optimizations) and the ESP value is increased with 4 bytes.
It may look difficult but it is not. Example:

Thinking about the maths of the stack, we can assume that if we put 0x20 bytes on the stack (by using 8 push instructions, 0x20 = 32) we can easily clean the stack by just modifying the ESP value: add ESP, 0x20. This is easier than 8 pop instructions.
We can now call functions. There are two very common methods to call functions, called stdcall and cdecl. The Windows API uses stdcall calling convention (method) and we will discuss only this one. However, they are similar, you can find more information here.
Let’s take the following function as an example:
[code language=”cpp”]
int function(int x, int y)
{
return x + y;
}
[/code]
We want to call function(0x11, 0x22). We need to know the following things:
- put the parameters values on the stack from the right to the left
- use “call function” instruction to call the function
- the call instruction will automatically put on the stack the address of the next instruction after the call instruction itself (and the ESP will be also decreased)
- we can see the result of the function in the EAX register
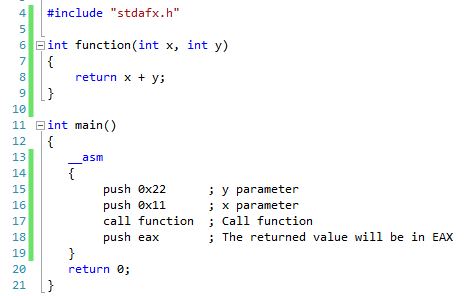
So after the execution of this function we will have the 0x33 (0x11 + 0x22 = 0x33) value on the EAX register.
So theses are the basics. However, we will also use some other instructions in our shellcode, instructions such as:
- xor destination, source – It is a binary operation, but we will just use it as “xor eax, eax” – The result of this instruction is that it changes the value of eax to 0. We use it to avoid NULL bytes
- lea destination, source (Load Effective Address) – Is used to put into the destination, the memory address specified by the source.
- lodsd – Put in EAX register the value at the address specified by the ESI register
- xchg destination, source – Exchanges the values of the operands: the source will have the value of the destination and the destination will contain the value of the source
ASM is a difficult language but if you take it step by step it is easy to understand it.
Conclusion
Even if we didn’t write any shellcode yet, we learned all the required information in order to be able to write a shellcode. We learned what is PEB and how can it help us, how a PE file looks like and even to write a few basic lines of ASM code.
In the next section we will actually write a shellcode, we will do something useful with the information gathered from this article and from the first part. As you will see, we will just apply the techniques learned here.
Part 3 page is not available, please make it available….
You can find the part 3 here:
https://securitycafe.ro/2016/02/15/introduction-to-windows-shellcode-development-part-3/